
Data visualizations allow for faster data analysis and decision-making as decision-makers can quickly grasp the significance of data points.

Biljana P.
Data visualizations simplify complex information, making it accessible to individuals who may not have a deep understanding of data analysis.

Mihajlo R.
Dashboards with visualizations offer a snapshot of key metrics and trends, making reports more concise and actionable.

Scott W.
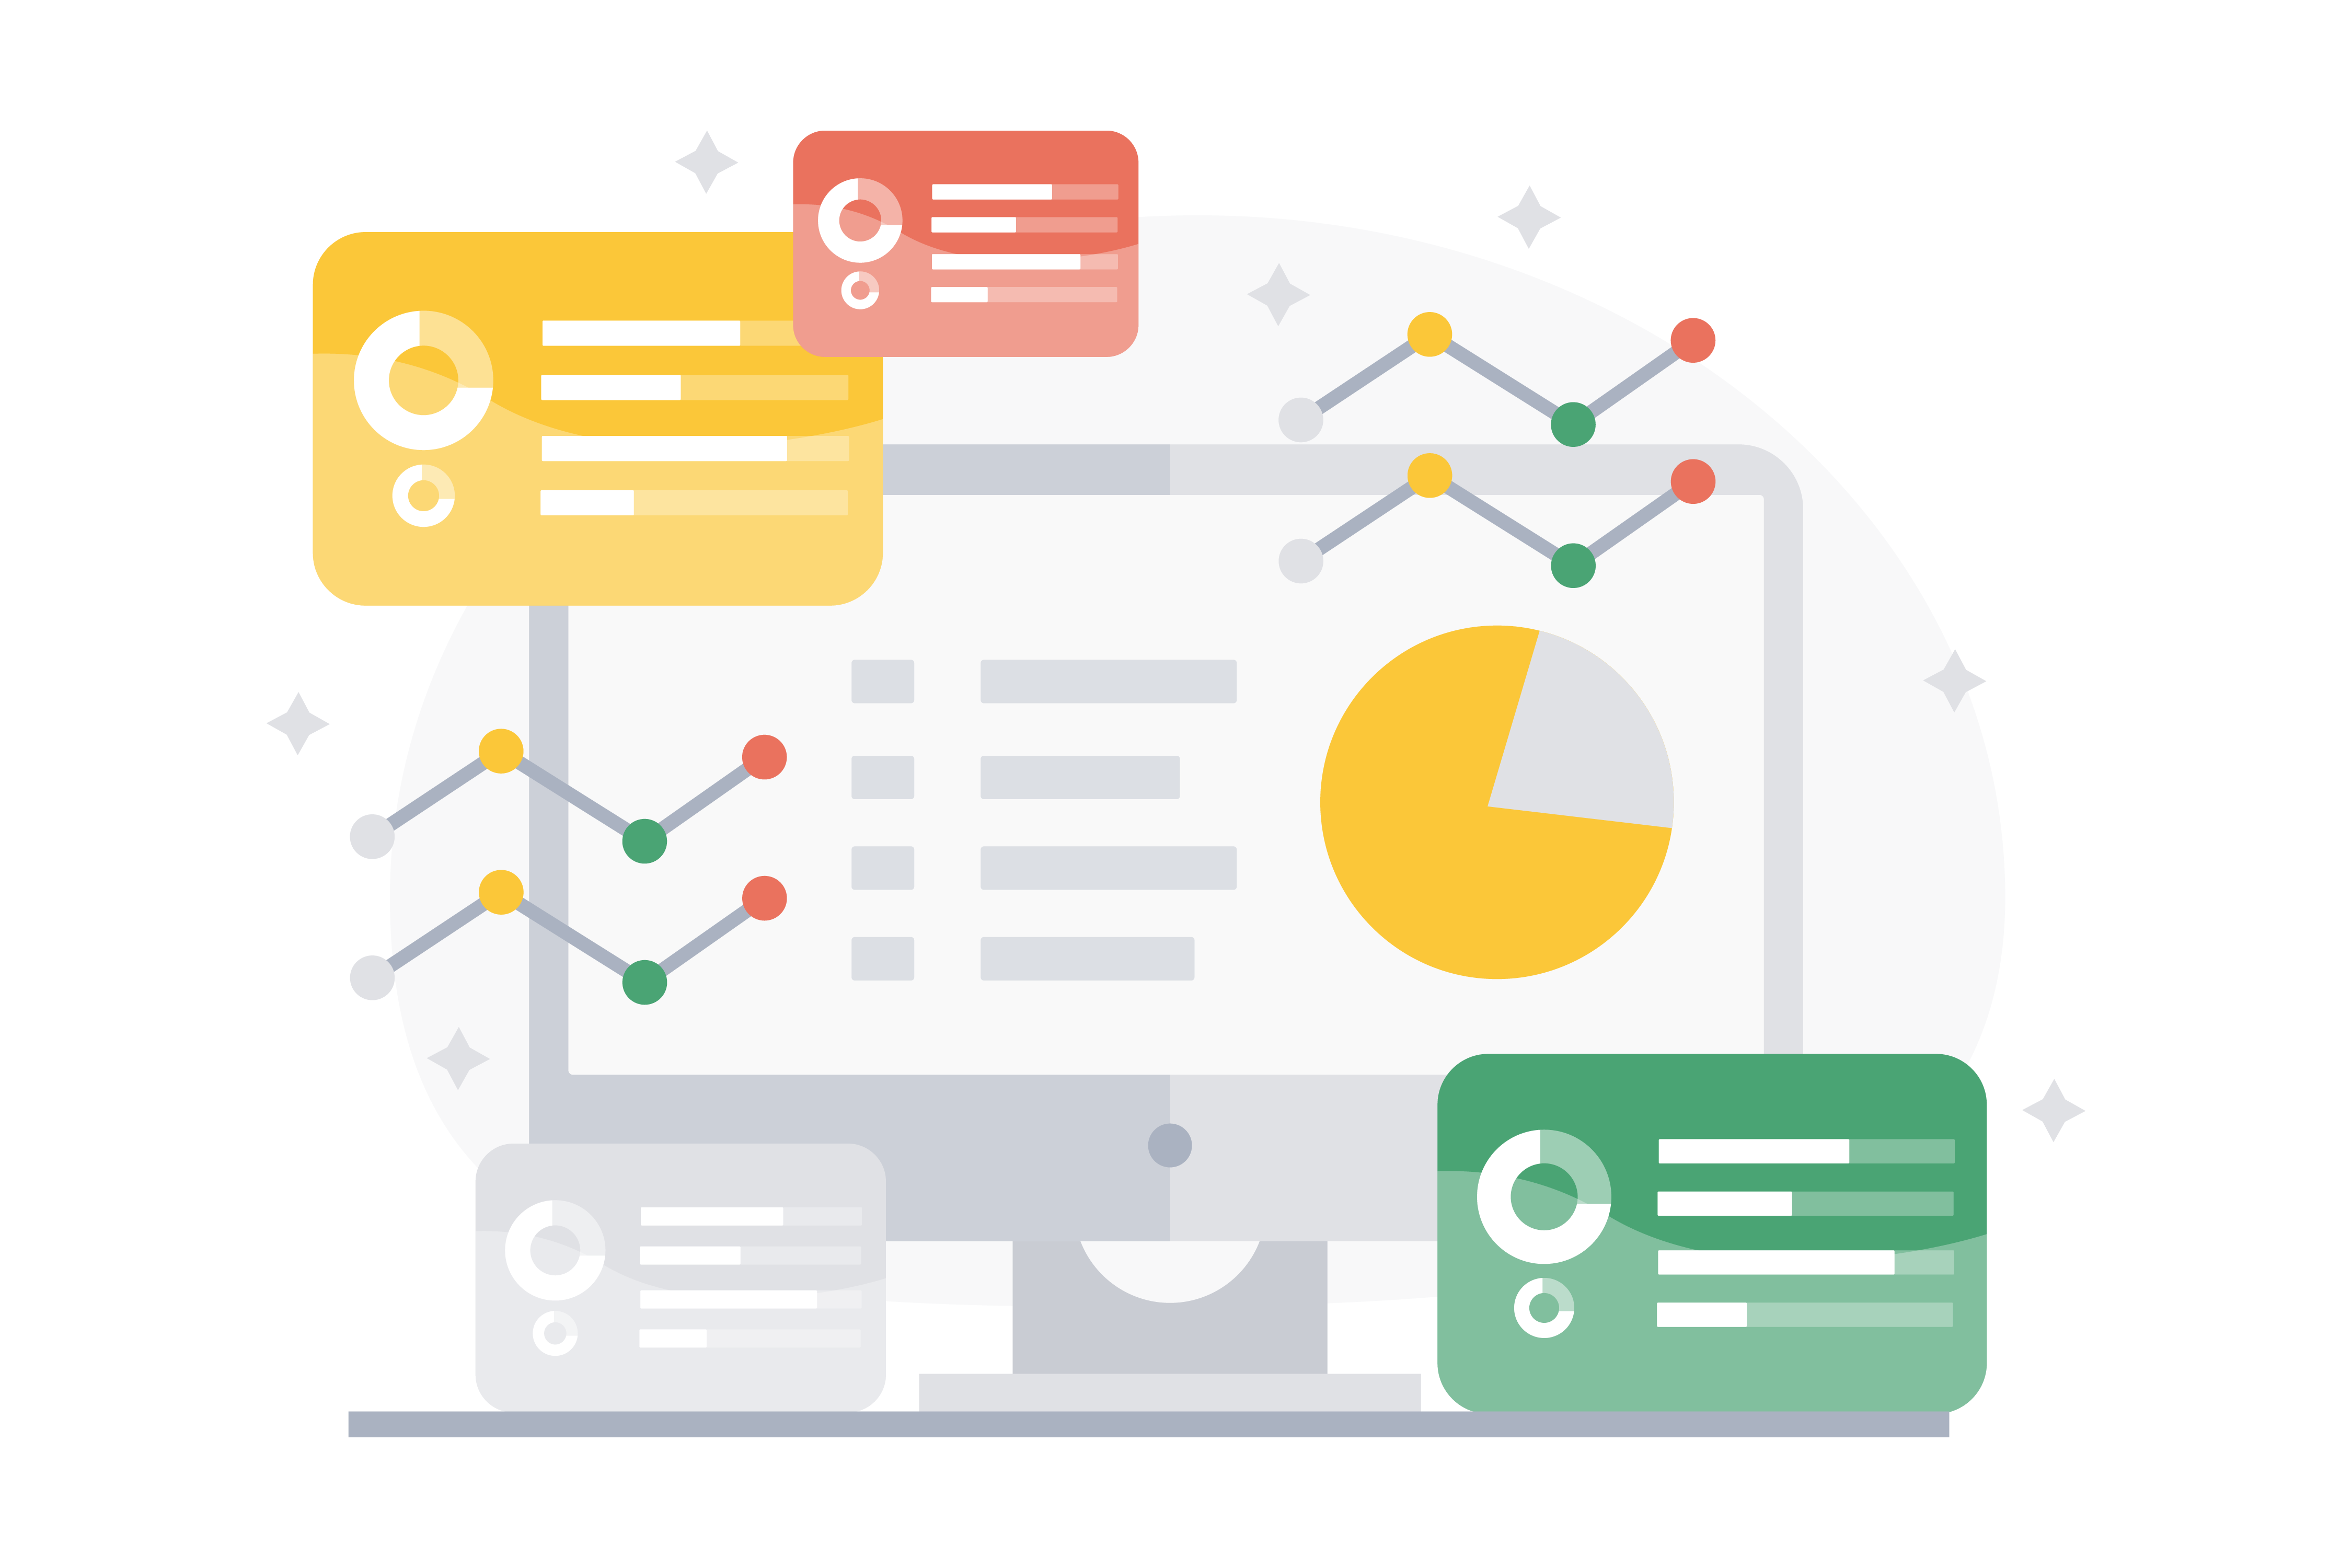
Unlock the Power of Data
VIDI is a learning analytics platform built specifically to address the needs of schools and universities. VIDI helps learning professionals harness the ever-evolving data landscape to turn information into intuitive visualizations: gaining insights, identifying trends, and making data-driven decisions easy.
Multi-Source Data Integration
VIDI integrates with various types of databases and file formats, allowing you to consolidate and analyze data from disparate sources. Whether it's SQL databases, Excel spreadsheets, CSV files, or APIs, our robust system ensures that your data is harmonized for a comprehensive analysis.
Comparative Analysis
Easily compare data from different sources side by side. Identify correlations, contrasts, and trends to make meaningful connections between datasets. Our tools make it simple to uncover valuable insights and make data-driven decisions with confidence.
Dynamic Dashboards
Transform your data into interactive dashboards that tell a visual story. Customize dashboards with charts, graphs, and other visual elements to highlight the information that matters most to you. Real time updates ensure you always have the latest information at your fingertips.
User-Friendly Interface
No coding or technical expertise required. Our user-friendly interface is designed for everyone, from beginners to advanced users. Easily create, customize, and share visualizations with your team, fostering collaboration and driving a culture of data-driven decision-making.

Whether you're a business analyst, data scientist, or decision-maker, VIDI empowers you to explore and understand your data in ways that were never before possible. Join the ranks of those who have unlocked the power of data visualization to drive success and innovation.
Ready to revolutionize the way you see and understand your data? Start your journey with VIDI today!